Articles · Mike Harty · Published 2026-10-24 · Updated 2026-10-24
Monte Carlo for MT5 Backtests: Drawdown Ranges, Slippage
Short answer: Monte Carlo resamples your backtest thousands of times to turn one drawdown figure into a range. For grid and recovery EAs, resample whole baskets, add slippage (+0.5, +1, +2 pips) and read the P95 drawdown and blow %. A high blow % means the worst single event is bigger than your floor. It isn't a forecast. In our runs, slippage hurt profit far more than drawdown.
Why one backtest path isn't enough
A backtest shows one order of events. A bad run of losses could have arrived earlier, before profits built a cushion, or several bad baskets could have arrived together. Monte Carlo asks what happens across thousands of plausible orderings.
Step 1: Choose the unit to resample
- Single-position EAs: each closed trade is a unit.
- Grid, martingale and recovery EAs: each basket, meaning all overlapping trades opened and closed together, is a unit. Record each basket's P&L, total lots and worst floating loss, not just its realised P&L. You can build baskets from the MT5 report's deals list: match positions first in, first out, then group any that overlap in time.
Step 2: Resample
Draw units at random with replacement (a bootstrap), as many as the backtest had, and do it 5,000 times with a fixed random seed so you can reproduce it. For each run, record: - max drawdown = the highest closed-equity peak minus (closed equity before a basket + that basket's worst float) - net profit - blow = whether any basket's worst float takes equity to 5% of your floor or below
Step 3: Add costs
Repeat each set with extra slippage per basket: lots × pip value × pips, at +0.5, +1 and +2 pips. Add a case with extra commission too (for example +1 pip with +$3.5/lot, and +2 pips with +$7/lot).
Step 4: Read the results
Read the P95 drawdown (only 5% of runs were worse), the median net after costs, and the blow %.
Real results: four EAs, 24 Oct 2026 (anonymised)
5,000 resamples each, from our MT5 backtests. These are backtests, not live results.
| EA | Basis and data | Floor | MC max DD P50 / P95 | Median net, 0 / +1 / +2 pips | Blow % |
|---|---|---|---|---|---|
| EA A (grid) | 0.07 initial lot, $10k, 29 Feb 2020 to 13 Mar 2026, 19% real ticks | $6,000 | $4,537 / $4,537 | $16,979 / $14,432 / $11,885 | 0% |
| EA B (grid) | 0.2 base lot, 1 Jan 2020 to 22 Oct 2026, 100% | $4,000 | $15,245 / $29,201 | $36,410 / $21,484 / $6,567 | 86% |
| EA B, excluding the open basket at the end of the test | as above | $4,000 | $7,715 / $7,715 | $51,412 / $36,461 / $21,513 | 63% |
| EA C (limited martingale-style recovery, hard SL on every trade), lower bound | 0.01 run ×13 per leg, 1 Jan 2020 to 22 Oct 2026, 100% | $4,000 | $1,252 / $2,337 | $10,703 / $8,305 / $5,839 | 0% |
| EA D (gold grid) | 0.01 run ×4, 1 Jan 2020 to 22 Oct 2026, 99% | $4,000 | $11,474 / $11,474 | $13,686 / $12,689 / $11,730 | 64% |
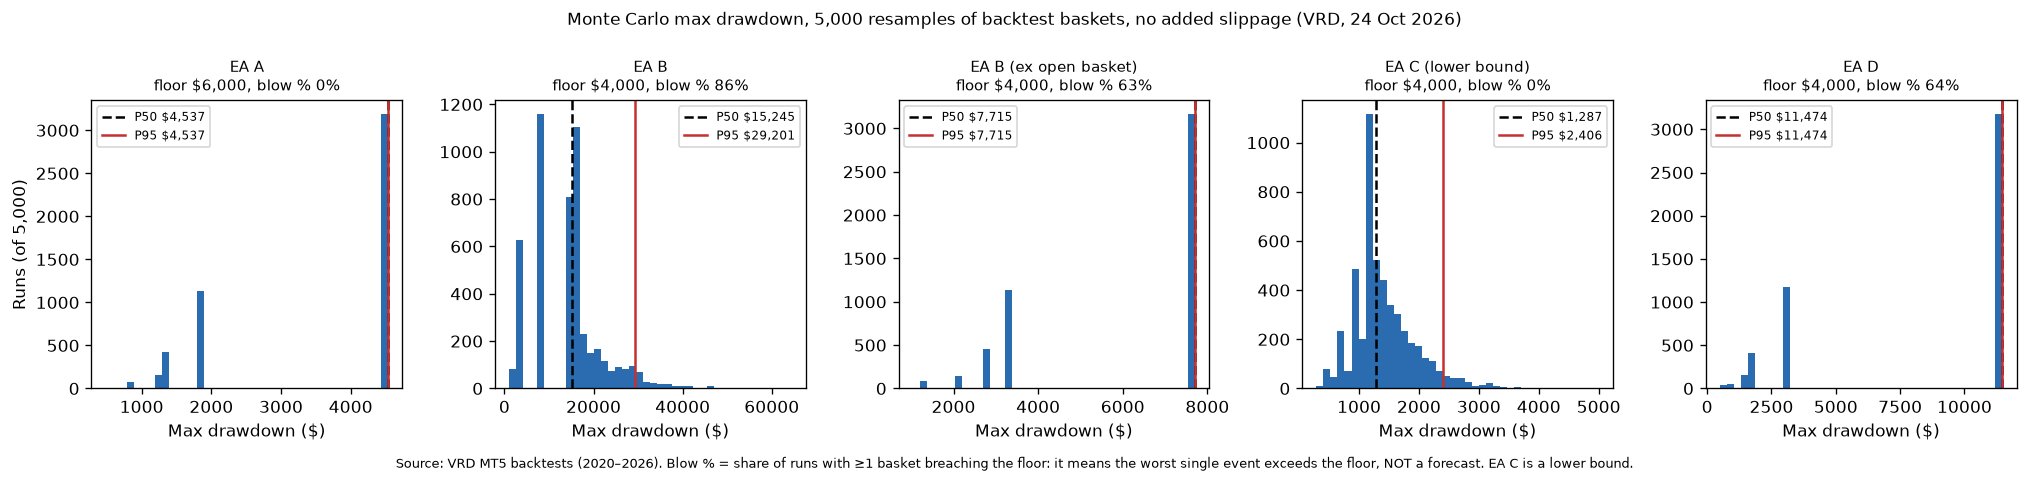
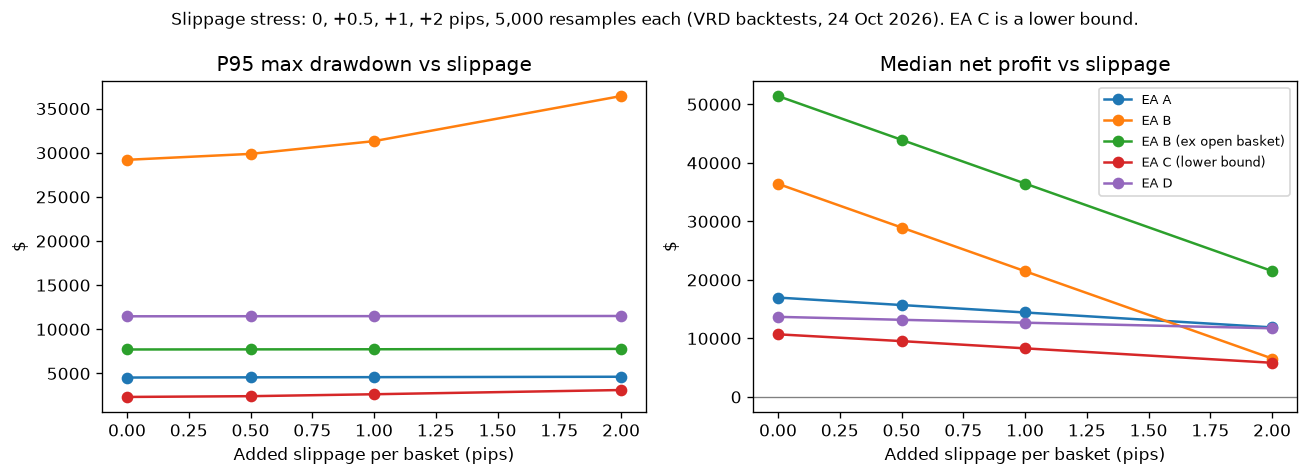
Source: VRD MT5 backtests and stress runs, 24 Oct 2026. The histograms re-run the zero-slippage case with the same method; EA C's percentiles differ from the table by under 3% because of the random draw.
How to read these numbers
- Blow %: a high blow % (EA B 86%, EA D 64%) means the EA's worst single backtest event is bigger than the $4,000 floor, so any resample that contains it breaches. Each basket has about a 63% chance of appearing in a resample, which is why one oversized basket gives a blow % near 63%. It is not a forecast of how often the account will blow. It tells you the floor is too small for the worst event the EA has already produced.
- P50 = P95 (EA A, EA D, EA B excluding the open basket): one basket dominates drawdown in nearly every run. Reshuffling can't shrink that event, so size from it.
- Slippage hits profit, not drawdown. EA B's median net fell 82% at +2 pips, and with +2 pips plus +$7/lot it went negative (−$3,808). Its P95 drawdown rose from $29,201 to $36,424. High-turnover EAs are the most cost-sensitive.
- EA B's backtest ended on an open −$14.8k basket. We counted it at its forced close. The version that excludes it assumes a recovery we can't confirm.
- EA A's backtest has only 19% real ticks, so its numbers carry lower confidence.
- EA C's drawdown is a lower bound. Its basket troughs use realised losses, because floating troughs weren't available, and it scales a 0.01 run. The real 0.85-lot backtest hit $8,399 of equity drawdown, above the P95 of $2,337. Its floor also depends on how the live lot opens. See how we backtest EAs.
Limits of Monte Carlo
- No new markets: it reuses events the backtest contains and can't produce a bigger move.
- Independence: resampling baskets one by one ignores baskets that overlap on different symbols, so account-level drawdown is understated.
- Backtest quality carries through: generated ticks, missing floating troughs and scaled lots all flow into the result.
- Simplified slippage: charged once per basket lot. Real slippage varies with news, liquidity and broker.
- No execution delay: we haven't modelled latency.
- Not live: none of this is a live or forward-test result.
Use it for sizing
Size the floor from the larger of the backtest's worst equity drawdown and the Monte Carlo P95, plus a buffer. Keep a reserve for events beyond it. See how much capital you need to run an EA and reading MT5 backtest drawdown.
Start free: VRD Insight
Once an EA is live, VRD Insight (free, on the MQL5 Market) tracks each EA by magic number, so you can see whether it stays inside its tested range. Insight's drawdown is calculated from closed trades, so on grid EAs watch floating equity as well. VRD Quant ($69) runs drawdown ranges on your own backtest, and VRD Complete ($149) bundles Insight, Guardian and Quant.
Risk disclaimer: Backtests and Monte Carlo stress tests are historical and hypothetical, not live results, and do not predict future performance. Nothing here is investment advice. Trading leveraged products carries a high risk of loss.
Frequently asked questions
What does a Monte Carlo test of an EA backtest do?
It reorders or resamples the backtest's trades many times. That gives you a range of drawdowns and profits, rather than the single path the backtest happened to take. Read the 95th percentile (P95), not the median.
Should I resample single trades or whole baskets?
For grid, martingale and recovery EAs, resample whole baskets. Their legs depend on each other, so shuffling single legs breaks the strategy and makes the drawdown look smaller than it is.
What does blow % mean?
It is the share of runs in which at least one event breaches the account floor. A high blow % means the EA's worst single backtest event is bigger than the floor. It is not a forecast of how often the account will blow.
How much slippage should I test?
Test at least +0.5, +1 and +2 pips per basket, plus a case with extra commission. In our tests, +2 pips cut one EA's median net profit from $36,410 to $6,567, while its drawdown barely changed.
Can Monte Carlo find a worse drawdown than the backtest?
Only by combining events the backtest already contains. It can't invent a bigger market move, and simple resampling ignores baskets that overlap in time, so treat its drawdown as a floor on the risk, not a ceiling.
One EA blowup costs more than the whole suite.
VRD Complete contains single-EA blowups and frees capital you have parked as idle buffers. $149 at launch pricing.